Meet our business partners
We’ll take care of that for you
Learn More


| Customer Group | # of People | Revenue Generated | % of Customer Group | % of Customer Group Revenue Generated | Avg. spend per person by customer group |
|---|---|---|---|---|---|
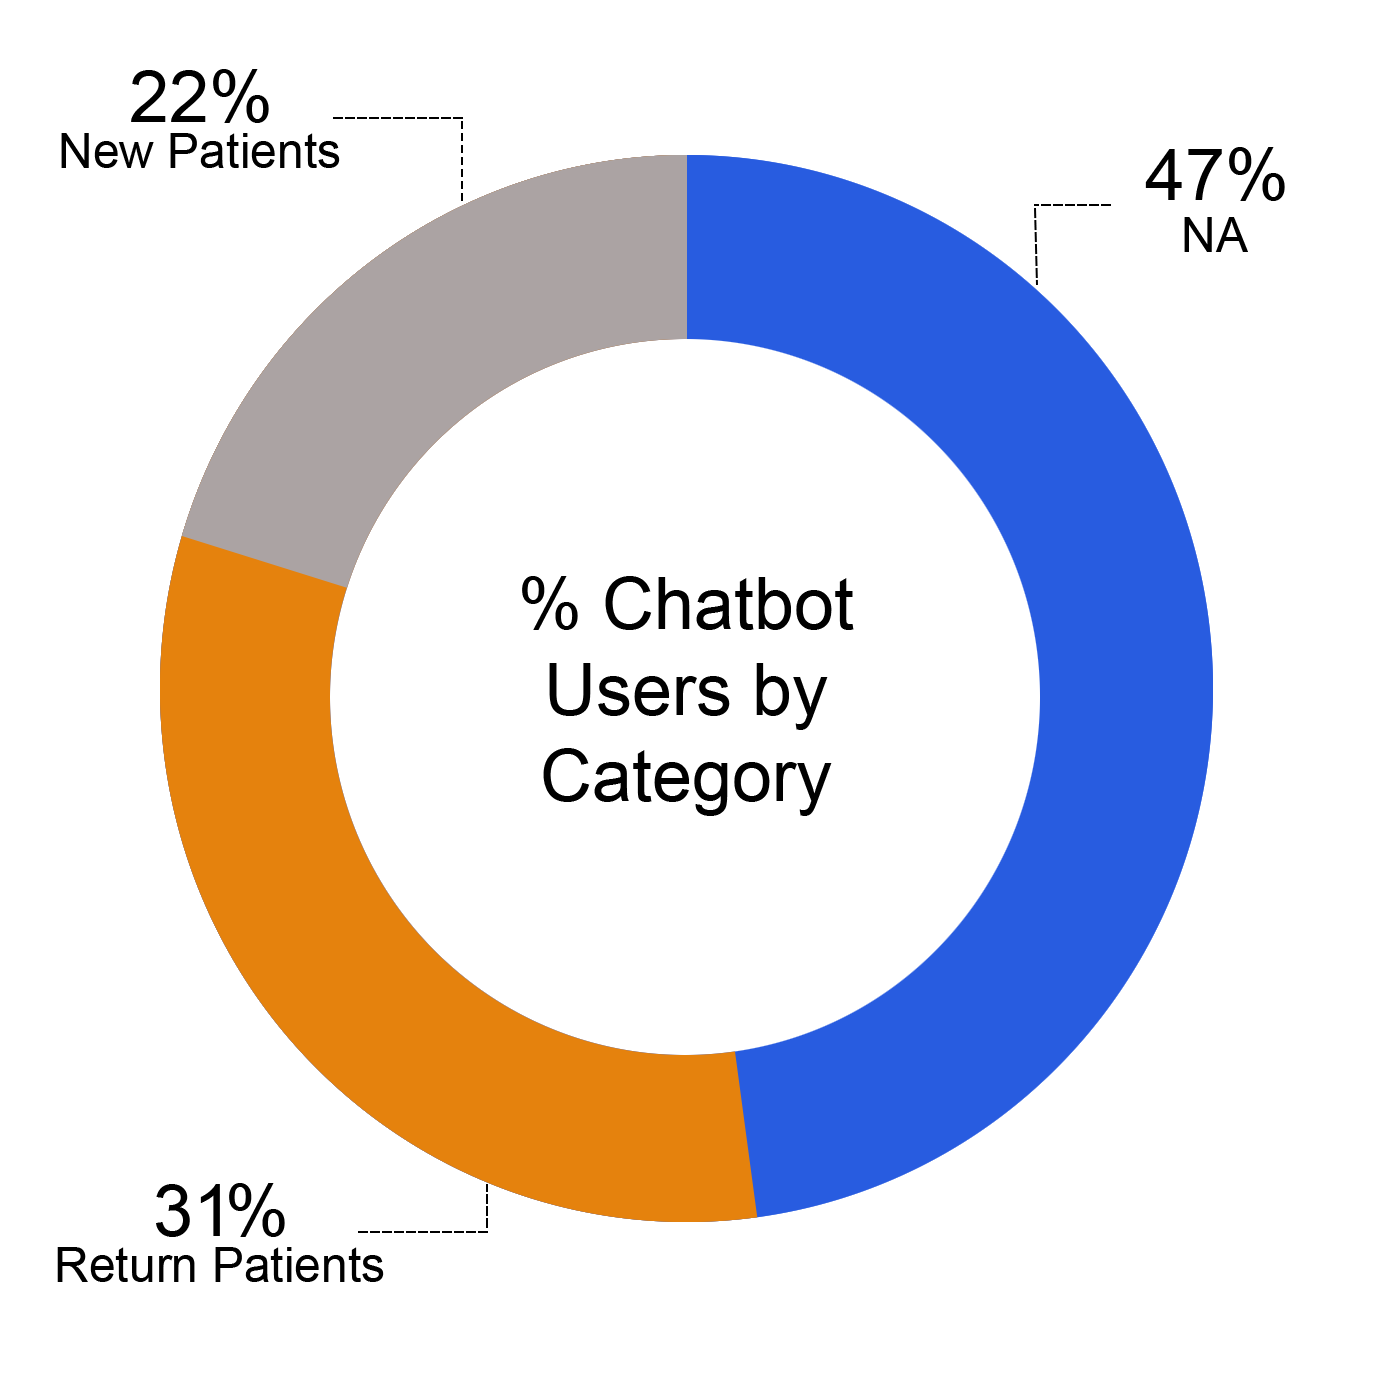
| NA | 103 | 0 | 47% | 0% | |
| Return Patients | 67 | $ 19,511.81 | 31% | 63% | $ 291.22 |
| New Patients | 47 | $ 11,686.18 | 22% | 37% | $ 248.64 |
| Total | 217 | $ 31,197.99 | 100% | 100% | $ 143.77 |
| Locations | # of People | Revenue Generated | % of Location Group | % of Location Revenue Generated | Avg. spend per person by location |
|---|---|---|---|---|---|
| Amherst | 52 | $ 9,471.33 | 24% | 30% | $ 182.14 |
| Cheektowaga | 17 | $ 1,663.38 | 8% | 5% | $ 97.85 |
| Elmwood | 67 | $ 11,117.34 | 31% | 36% | $ 165.93 |
| Kenmore | 26 | $ 2,837.92 | 12% | 9% | $ 109.15 |
| North Buffalo | 20 | $ 2,167.00 | 9% | 7% | $ 108.35 |
| Total | 217 | $ 31,197.99 | 100% | 100% |
| Return Patients | New Patients | NA | Total # of People | % (NA) | Total without NA | % Return Patients | %New Patients | |
|---|---|---|---|---|---|---|---|---|
| Amherst | 17 | 11 | 24 | 52 | 46% | 28 | 61% | 39% |
| Cheektowaga | 4 | 3 | 10 | 17 | 59% | 7 | 57% | 43% |
| Elmwood | 15 | 28 | 24 | 67 | 36% | 43 | 35% | 65% |
| Kenmore | 11 | 1 | 14 | 26 | 54% | 12 | 92% | 8% |
| North Buffalo | 6 | 1 | 13 | 20 | 65% | 7 | 86% | 14% |
| Niagara Falls | 14 | 3 | 18 | 35 | 51% | 17 | 82% | 18% |
| Total | 217 |